Project #6
Data Portrait
6.1 Data Portrait View the Code
Description
This is a data visulization from a week of recording on my mental status changing throughout the day. From left to right is the date change from Monday to Sunday, and from bottom to the top is the change from morning to night.
Design Process
This data collection and visualization was developed based on my data visualization and sketch assignment from Major Studio 1 class. Instead of using dots, like what you see below, I recreate this data visulization by using an arch to represent it. From my perspective, the change throughout the day like how circle slowing growing larger from inside to out. In other words, everything is accumulated step by step. And the changing throughout a week is like a circle that slowly mapping out on canvas from one side to another.
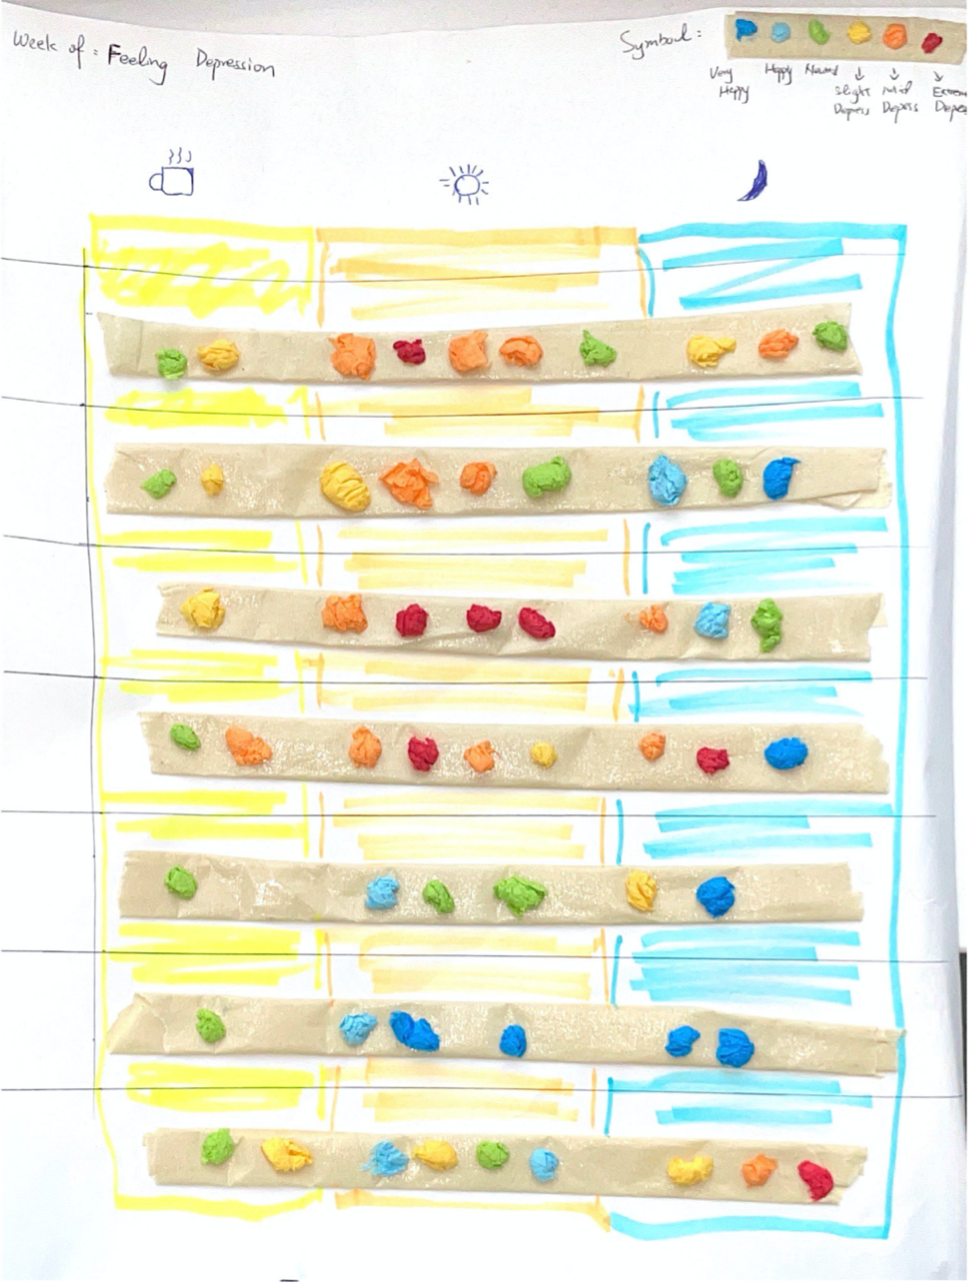
6.2 Depression Data Visulization from MS1 Assignment
Reflection
This data visulization recorded how my mental status and mood get change rapidaly and dramatically throughout a day. From my perspective, the digitalized process is giving more dinamic to the numeric data. Instead of reading and understanding what numbers and things are representing, viewers have a more direct hit on the data which had been recorded. On the other hand, the visulization process giving me, as an artists, some time to process and think how I want to express and convey my thoughts through different combination of visual effect. As a result, I believe data visulization is a great way make more people understand data easily and quickly.